What is Descriptive Analytics in Data Analysis?
Businesses generate a ridiculous amount of data each day, whether they’re a small business or an enterprise. Guaranteed, they have everything from website visits, to marketplace interactions when cross selling on multiple e-commerce platforms (like having their products on Etsy, as well as their site), interactions from multiple social media accounts (think Facebook, Instagram, Tiktok, LinkedIn), and that’s all before we even get to the sales transactions.
Now that’s a lot of data to track, but all of this information can come in handy and reveal valuable insights when analysed and used correctly.
Now what actually is descriptive analytics and where does this come into it?

What Exactly Is Descriptive Analytics?
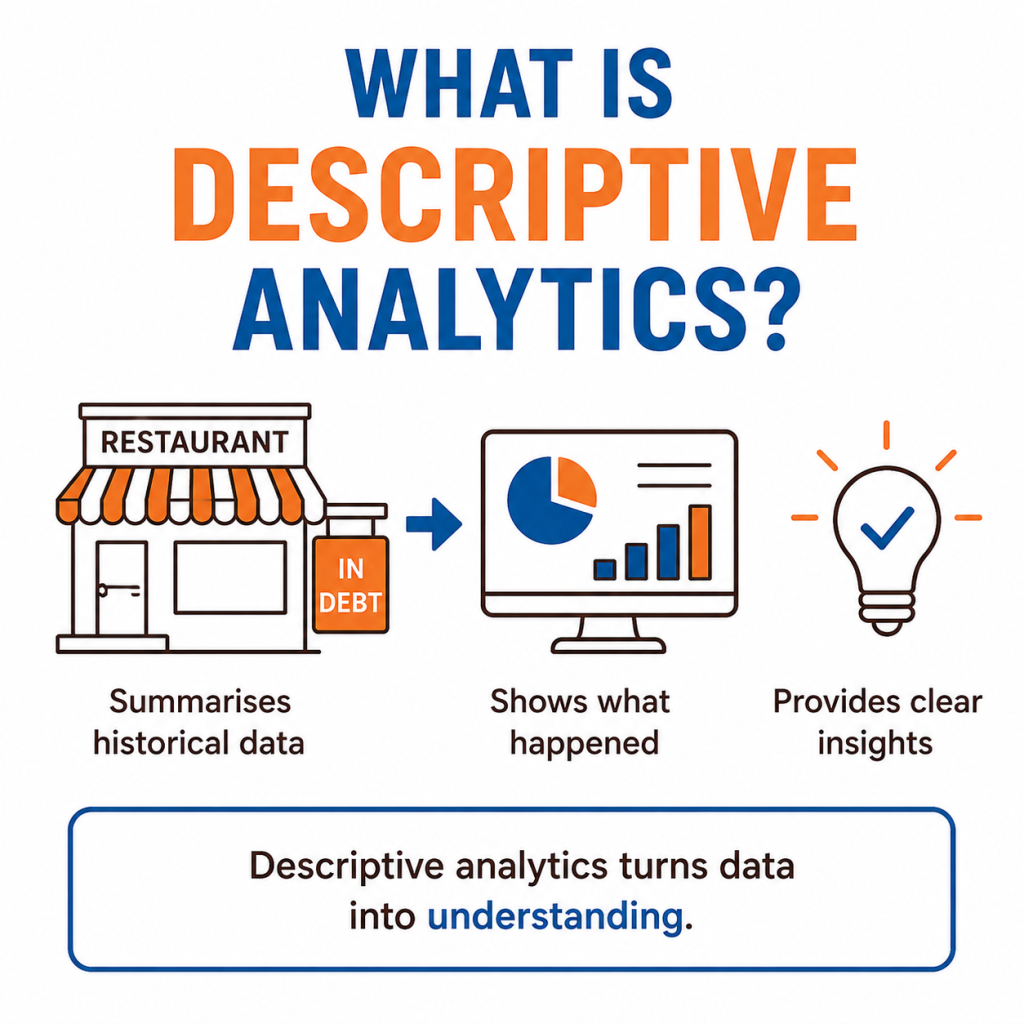
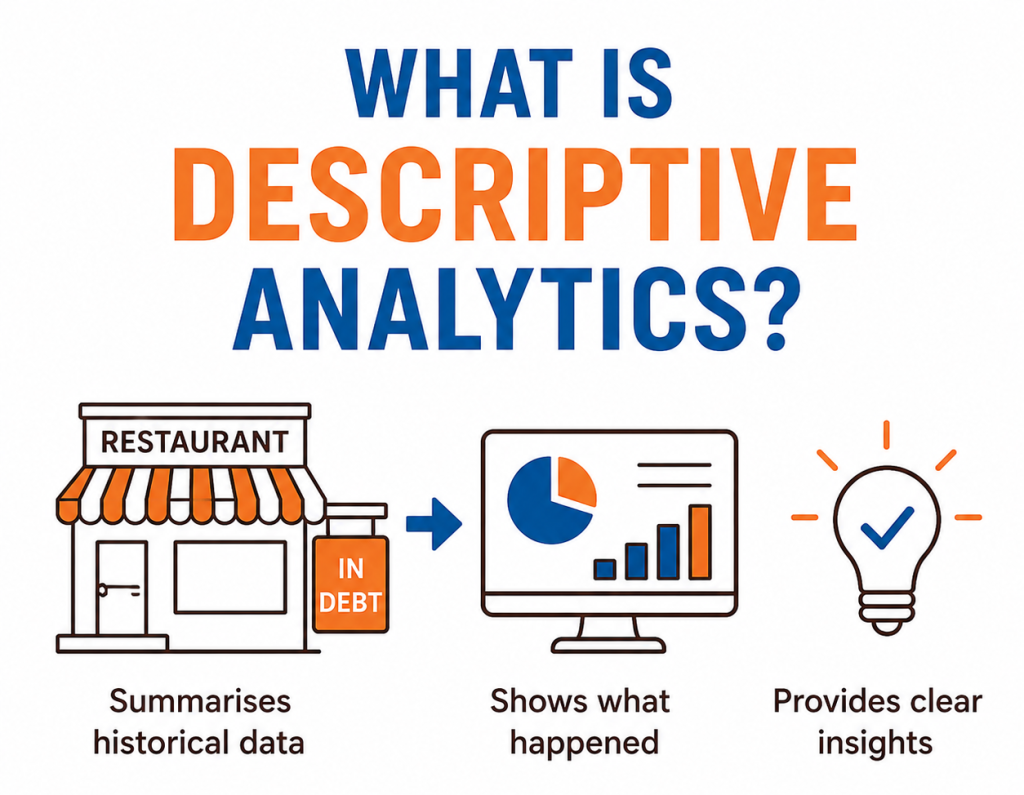
Descriptive analytics is a type of data analytics that uses historical data to identify patterns, trends, and general relationships. It aims to answer just one question: “What on earth happened?”.
For example, you’re watching Gordon Ramsay’s Kitchen Nightmares and you’re witnessing the absolute shambles that a restaurant has fallen into. Gordon will step in, but before he can make changes and figure out why things have took such a severe downturn, he has to actually figure out what has happened. This is exactly what descriptive analytics aims to do and the question that it aims to answer – what happened?
So by looking at past performance data, different organisations or businesses (like the failing restaurant) can begin to gain a better understanding of what is going on, what needs to change, and the possible future outcomes from the actions they begin to take. They can gain a better understanding of customer behaviour, monitor their progress towards goals, and begin to make decisions based on data, not just assumptions.
Okay, let’s stick with the same example for now. The failing restaurant has been around for 5 years and fallen into severe debt. They get an okay number of customers each day, especially during lunch time, but in summary, the business is losing more money than it is making. This would be the general descriptive trend of what is going on or what has somehow happened.
Now, diagnostic analytics (which is another type of data analytics) would be what determines the “why” – so why the restaurant has fallen into debt and is not turning a profit. This may be factors like high rent, too many staff on shift at once so the company is paying out more wages than customers are buying menu items, or even that stock may be going out of date way before it gets used up for the menu.
Without any changes, and with the general pattern and theme of how the restaurant has been preforming in the past, predictive analytics (yet another type of analytics), would then allow us to predict what the future of the restaurant would look like.
To keep it simple, in this case, something clearly has to change.
An analytics professional would look at the data the business is already collecting and state what has happened. For example, the Point of Sale (PoS) transactions of the restaurant would tell you what items the customers are buying, whilst revealing what items are underperforming.
So, no matter what kind of business you run, and what data you collect, whether that be website analytics, sales performance, customer insights, or something else, descriptive analytics is what gives you the baseline foundation of what you need to start making smarter decisions for overall improvement.
Without identifying what has already happened, you can’t really begin to address and patch up the issues to then fix the business operations.
This is why when you often look at analytics summaries, you can clearly see things like sales performance this month compared to last month, and so on.
How Does Descriptive Analytics Work?
Now that we know what descriptive analytics is, how does it actually work? What has to happen for us to be able to make sure that the current summary of data is accurate when we are showing what has happened?
In order to be able to use historical data to understand past events and business performance, we need to first collect the data, organise it, and then analyse. Without the descriptive analytics stage, it is hard to step into the next stage of more advanced analytics like diagnostic and predictive.
The goal at this stage is to summarise data, not predict future outcomes. So to actually pick out the trends, begin to monitor key performance indicators (KPIs), and create reports to show what has happened over time, a few different key stages need to be ran through first so that the raw data in those dozens of spreadsheets that a business may have, can be turned into something actually useful that brings the business value.
Data Collection
The first step involves gathering the historical raw data from various sources.
Sources, aka places, which businesses may gather their data from could be anything from customer relationship management systems (CRMs), Point of Sale (PoS) transactions, sales databases, customer surveys, financial records, social media platforms, or even website tracking tools (e.g. Google Analytics).
This data would need to be squeaky clean to be accurate, as data which is messy can lead to later problems. The more complete and accurate the data is, the more accurate and valuable the analysis will be.
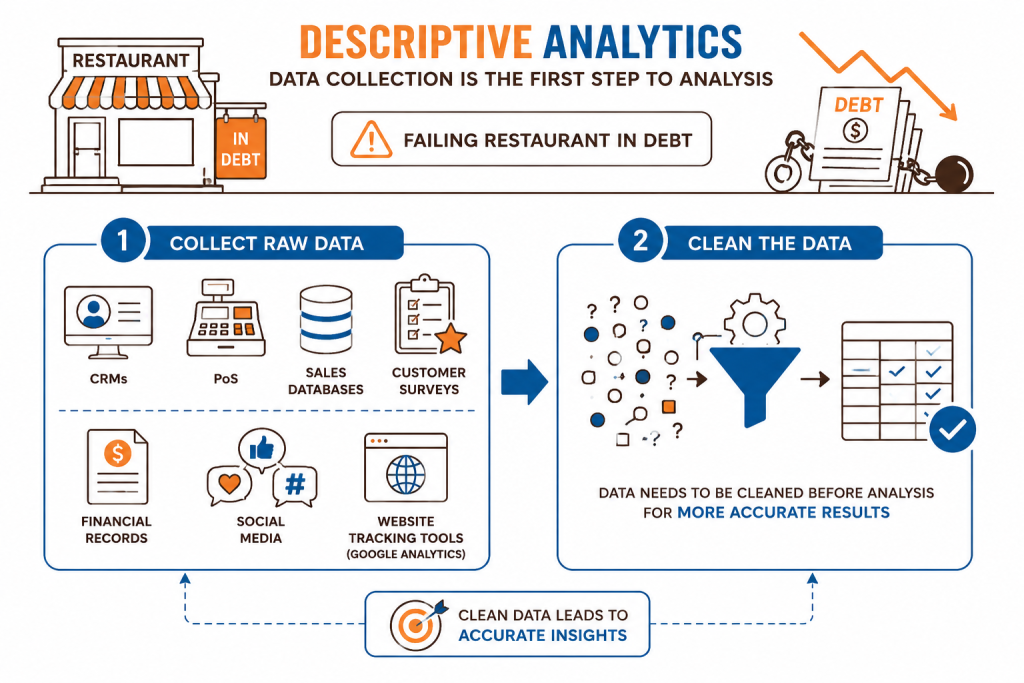
Data Cleaning
Before analysis begins, organisations may need to clean their data or hire a professional to do this for them. It’s essentially just preparing the data for analysis. This may include things like removing duplicate records, correcting errors, filling missing values or accounting for them, and even standardising formats (e.g. all dates follow a day/month/year format, as opposed to month/day/year).
This step is vital, as data which has not been cleaned or prepared can lead to misleading results. For example, if you own a restaurant and the data is off, it could lead to results which lead you to make the incorrect decisions on how to run it if the data isn’t cleaned before analysis begins.

Data Analysis
Now that the data has been collected, cleaned, and prepped for analysis, data analysts use a few different statistical analysis methods and descriptive analytics techniques to reveal those patterns and trends.
Common techniques include:
- Summary statistics
- Trend analysis
- Data aggregation
- Data mining
- Frequency distributions
- Correlation analysis
This stage may sound a little complicated and we do go into this in some of our other blog posts and cover what the different methods are, what they do, and how to even run them in different programs or using different tools.
However, the results of these analyses will then be exactly what allows them to report back to the business owners and tell them the bottom line of what has happened (descriptive analytics), why it has happened (diagnostic analytics), predict future outcomes (predictive analytics), and then give pointers as to what has to be done to make fixes or possibly change future outcomes for the benefit of the business (prescriptive analytics).

Reporting and Visualisation
Now, not every person is going to understand what a p-value is or what the methods of these results, or even why they were ran, are. A lot of it may end up sounding like complete and utter nonsense, just a bunch of statistical terms that go in one ear and come out the other.
Due to this, the final stage of analytics would be presenting the findings through data visualisation and reporting tools. These are what make the data understandable. So businesses may use dashboards, charts, graphs, KPIs cards, or even business reports to show the data. They tend to use tools like Tableau, Power BI, or Excel, to make it easier to communicate insights to stakeholders and support their decision making.
For example, when you blab on about sales numbers of numerous products, not everyone’s brain jumps to “oh the restaurant is selling way more lattes than americanos across the year”, but a product sales pie chart would be able to make them understand that in seconds.

Why Is Descriptive Analytics Important?
“Right, so why do I need descriptive analytics? Anyone can guess work that this month’s sales were better than last month’s!”
Modern companies, including restaurants, rely on data driven decision making to remain competitive. Without knowing what happened in the past, it becomes harder to improve future performance. In the case of the restaurant, without looking at past data like best selling items, it can become difficult to determine what sales are going to look like in the future.
Plus, isn’t competition the fun of it? If there’s a restaurant next door selling everything the same as your business, EXCEPT for ice cream in the summer, of course the sales are going to work in your favour – the descriptive yearly summer ice cream sales figures will tell you just that.
One of the biggest upsides to descriptive analytics is the ability to turn raw data that doesn’t mean much into something that means a lot. For example, anyone would get bored scrolling through thousands of rows of sales data on Excel. Now imagine those are broken up into dozens of columns for other factors like menu item categories, customer demographics, and so on. Tedious, right?
To avoid the long hard work of figuring things out manually, businesses use dashboard reporting, data visualisation, and KPI tracking to instead understand performance. And quickly at that.
In simple terms: Descriptive Analytics = the golden ticket to the chocolate factory identify opportunities (potential new best sellers before they’ve even hit the menu for the restaurant), solve problems (goodbye debt, hello increased revenue and profit), and improve operational efficiency (like introducing a “soup of the day” to use up excessive produce that would otherwise end up wasted at the end of the week).
How Can Descriptive Analytics Help My Company?
The insights through descriptive analytics act as a starting point to deeper analysis and strategic planning. Here are some things that descriptive analytics can tell you about your business:
- How customer satisfaction scores changed over time
- Which products generated the most sales
- How much website traffic increased over the last quarter
- Which marketing campaigns produced the highest engagement
So we’ve now explained that Descriptive Analytics helps us to monitor performance and identify trends of what is going on in our businesses.
But maybe we are still struggling to grasp what descriptive analytics in real life looks like?
Don’t worry, I’ve got you.
Ready To Make Better Decisions With Your Data?
And that’s it!
Thank you for making it to the end, but let’s not end it here. Let’s discuss your next project!
What is Descriptive Analytics in Data Analysis?

Data Analytics & Reporting For Better Business Decisions
Designed with WordPress