Data Analytics & Reporting For Better Business Decisions
Businesses of all kinds collect more data than ever, often across numerous customer relationship management (CRM) systems, through physical feedback boxes, surveys, you name it – but struggle to make use of that data.
You may be here wondering, “What even is Data Analytics?” or “What’s reporting?”, or even “Why would my business need those things?”. I’m here to address exactly that and to break down the technical jargon that comes along with statistics and new tech in general that can be quite off putting for the average person. Confusion doesn’t benefit anyone, so let’s simplify it.

What Is Data Analytics?
Data analysis and reporting systems help businesses understand how their company, service, product, or whatever it is that you’re offering to your customers is performing.
Every business collects data, whether it’s sales figures, customer purchases, website visits, or even employee performance. Data Analytics helps us move from just having that information, to actually understanding what it is telling us.
For example, imagine a coffee shop that has been around for 5 years, and across that time they’ve gathered thousands of sales records. They may sell several products (latte, flat white, cappuccino, americano), all of which are seemingly selling well to their daily customers and bringing in revenue and profit for the business owner. Using the existing data from their point of sale (PoS) system, a data analyst would be able to inform the business owner of their product performance, identify opportunities, and help them make better decisions when it comes to pricing, their current and future offers, where they may be losing sales, how they can increase their per sale profit, and so on.
Essentially, the data is already being collected by the coffee shop. But the business owner may not be aware of the ways that they can increase their profits, or may not have noticed patterns in their data that indicate they are losing out on profits in certain areas. A data analyst would be able to identify these trends, patterns, risks, and opportunities, and explain them. Through reporting, they would then show visuals like graphs or charts that can make it easy to understand for the business owner and even offer insights into what can be improved.
Instead of relying on assumptions, a data analyst would be able use a combination of what’s the holy trinity in statistics: descriptive, diagnostic, and predictive analytics (this allows them to gain insight into the business).
You may be thinking, “ahhh, what do these terms mean??”, and we go into much more depth in some of our other insights posts.
However, in the simplest of terms:

TLDR; Raw data can be turned into meaningful insights that allow us to look at tons of factors like customer behaviour (e.g. do some types of customers spend more than others?), sales trends, operational performance, how effective marketing is, and so on. This then allows business owners to prepare and make better decisions – with me so far?
What Is Reporting?
Reporting aids data analysis – all this is, is the act of presenting data in a clear and actionable way. Many business owners will be familiar with meetings that involve monthly business reports, executive dashboards, and performance tracking. These tend to involve defining Key Performance Indicators (KPIS) for the business, sometimes dashboards, and visualisations like graphs or charts to show the data in a way that is easy to understand.
For example, a pie or a bar chart can effectively convey which product in the coffee shop is performing best. Visualisations are a great way to communicate key metrics in seconds.
Data Analytics vs Reporting: So What’s the Difference?
To summarise, data analytics allow us to investigate why something has happened. Like revenue losses, or a major boom in new customers. Reporting allows us to show what happened. Both are beneficial and they work hand in hand – one shows, the other explains and tells you what should happen next.
Reporting shows us what happened by presenting information in an easy to understand way, often by displaying things like graphs or figures. For example, for a coffee shop, it may show things like how many lattes were sold last month, how many customers visited the North East branch, and which products generated the most revenue.
Data analytics then takes this one step further, instead of just showing what happened, it helps determine the factors behind what happened. Reporting may show that 500 lattes were sold last month, data analytics then investigates as to why that actually happened. For example, did latte sales increase due to a successful marketing campaign on socials? Did the new syrup launch announcement draw in the matcha fans? Was the weather rainy and people wanted to sit inside somewhere cosy?
Signs Your Business Could Benefit From Better Analytics
Common Questions Businesses Want Answered
Okay, so now that you’ve reaffirmed to yourself, “Gosh, I do spend a lot of time creating these manually”, any questions? I’m betting you have plenty.
Some of the most common questions that business owners want to know when looking at their own data are often:
The Common Questions Data Can Answer
- Which products perform best?
- Where are we losing customers?
- Which activities generate the highest return?
- What trends should we prepare for?
- Where can we improve efficiency?
- Are we missing any opportunities for growth?
They’re natural questions and exactly what you should be thinking about when collecting and analysing your own data. But if you have numerous CRMs, manually create reports, and in the end don’t bother to actually make use of the data because it’s confusing or reporting just takes too long – don’t worry, we’ve all been there! Lucky for you, Pendulum Data Automation is the big shot data nerd ready to step in and simplify things when you’re ready.
Tools & Platforms We Work With
So now you’re thinking, “Yeah alright, take a crack at it. Our data is messy. Good luck buddy!”. Perfect. Consider your data sparkling once it’s been through the Pendulum datawasher.
We use a combination of tools to help you with your data including Power BI, Tableau, Excel, SPSS, AI-assisted analytic technology, and more. Each of these have their own strengths and the route we take really just depends on your needs. We break down what each of these do in another insights post – but you focus on the results and outcomes, we’ll focus on the tools and processes that will get you them.
So whether you need custom reporting solutions, or whether your CRM is basically a messy notebook you use as a “Dear Diary“ every other day, we can help automate things and make them more simple.
Our Approach
So what’s next? Our golden approach to bagging you as the next date in our calendar, of course.
When you get in touch, we begin by typically responding in one business day and setting up an initial call or discussion that works for you via your preferred method of contact. Don’t worry, we know the feeling of “this meeting could have been an email“ just as much as the next person – so whether you prefer Zoom, Google Meet, phone call, text, email, we’ve got you.
During this discussion, we try to understand your goals based on any information you’ve left us through the contact form you’ll have filled out.
Want to be our dream client? Good. Now here is a small snippet of some of the questions we typically tend to ask, and honestly, having these prepared can be a great way to show us you’re serious about improving your business. Enough bad corporate jokes now (we know you wouldn’t be this deep in the depths of this post if you weren’t serious), so:
- What is your business size? (Small business, small to medium, enterprise?)
- What kinds of data are you already tracking, and on what platforms? (Excel, Google Sheets, Notion, Hubspot? Any others I could not think of on the spot whilst writing this?)
- What are your biggest goals? (I do want to hear about how you apply for London marathon every year but maybe at the end – what are your goals for your business? More revenue, more time, stopping unnecessary spending? What’s that sparkling revenue number that’s been twinkling in your head since you started your business?)
Once we have had the discussion and defined what specific goals your business has and by default, what you require from us, we provide you with a brand new shiny project proposal! Oh goody!
It’ll define everything we’ve discussed in terms of your requirements, budget and pricing, project timelines, whether you would want to consider any revisions after the project has been completed, your preferences for visuals that you’ll actually be able to understand, and so on.
You accept the proposal. We skip to the honeymoon (straight to us assessing your current data that you provide). We don’t require access to any CRMs, and spreadsheets exports can be sent directly to us if preferred – whatever the method, we work with you all the way.
We then build reporting and analytics solutions based on your needs and the scope of the project (don’t stress, we will use your company hexcodes and keep the visuals golden).
Analytics. Check. Reporting. Check. And finally, we deliver the insights and recommendations from your data. Scrumptious! And ongoing support of course, it doesn’t just end there. We are happy to continue to support you beyond the project, whether it’s every once in a while or continuous on a regular basis!
Ready to Make Better Decisions With Your Data?
If there’s anything still a little bit confusing, like what some of the tools we use are specifically for – check out our other insights blog posts that break down just those details.
Thank you for making it to the end, but let’s not end it here. Let’s discuss your next project!
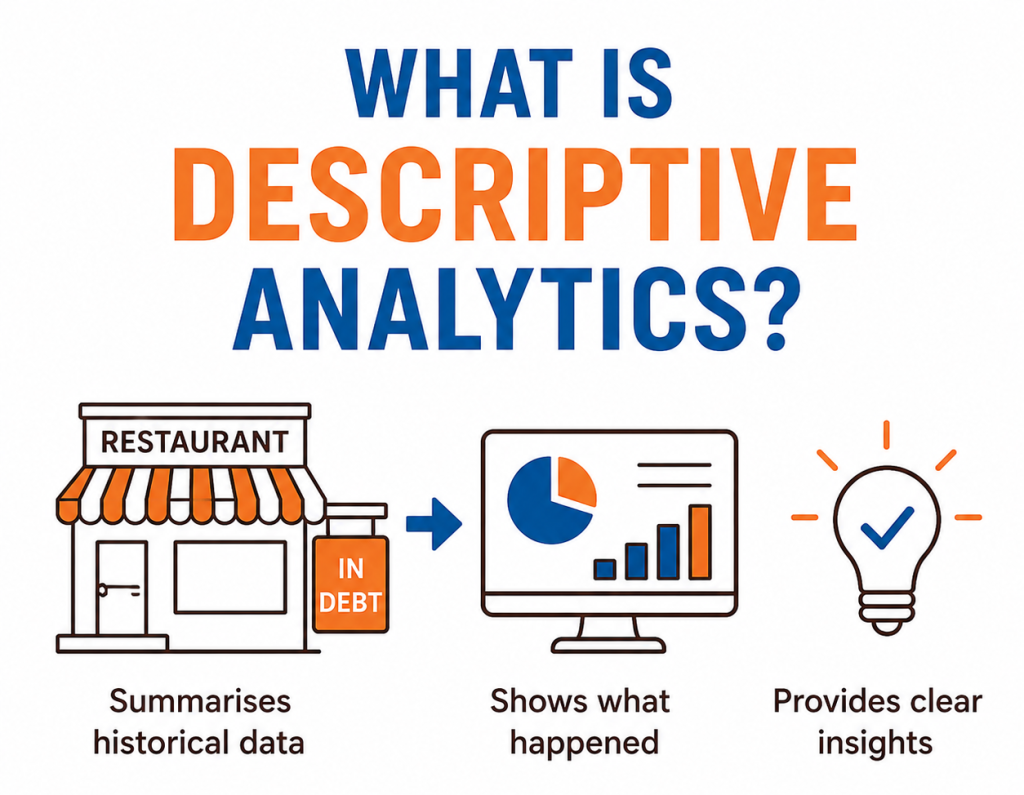
What is Descriptive Analytics in Data Analysis?
Data Analytics & Reporting For Better Business Decisions
Designed with WordPress